-
Download:
My Results |
All BMPs
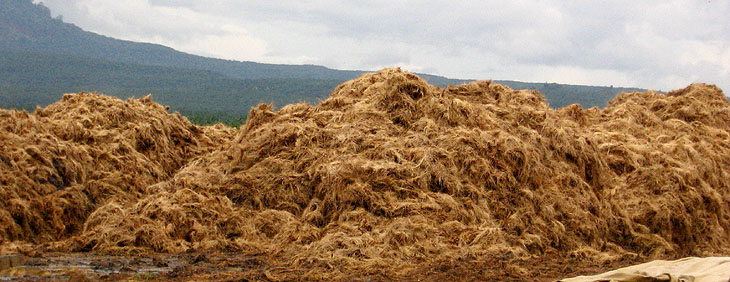
Empty Fruit Bunch (EFB) Composting
Category: Nutrient Recycling
Practice Type: Management
Landuse/Agriculture Type: Palm Oil
Climatic Zones: Tropical
Regions: South Asia, Africa, South America
Pollutants Treated: Nitrogen, Phosphorus, Sediment
Description: After harvest of the palm fruit, empty fruit bunches (EFBs) can be placed back to the field as mulch. To make spreading easier, some will chip the material, which makes mechanical spreading easier. Recycling nutrients from agricultural waste products generated in palm oil production can reduce the demand for commercial fertilizers and provide an alternative use for waste. 1
Implementation Considerations: The bunches can be transported on return trips with the same trucks that pick up the harvest. In-field transport and spreading can be a logistical problem. Thick layers of mulch can cause fly problems. Single layers usually do not give such negative side effects. Mulching will incur additional labor and transportation costs.
Scalable to small farms? Yes
1 "Palm Oil BMP: Reduced Fertilizer Use." World Wildlife Fund for Nature. Web. http://wwf.panda.org/what_we_do/footprint/agriculture/palm_oil/solutions/roundtable_on_sustainable_palm_oil/better_management_practices/fertilizer_use/ .
Erosion and Sediment Control of Construction Sites
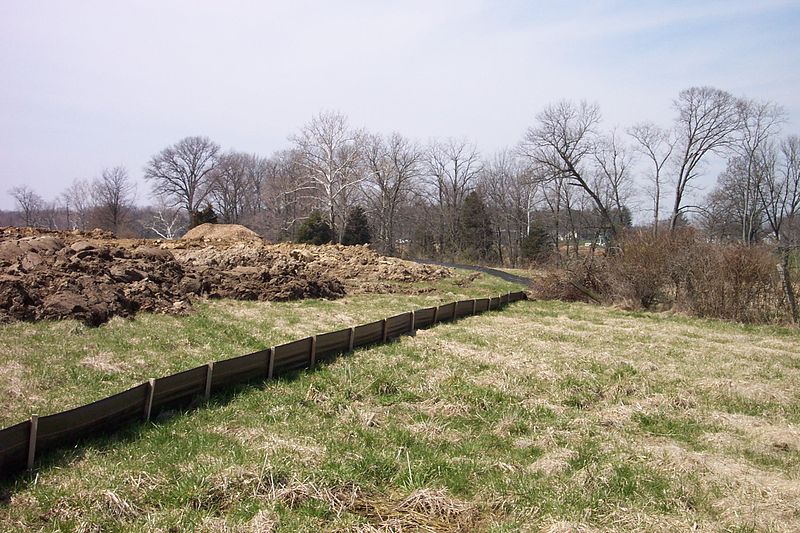 A silt fence, a type of sediment control, installed on a construction site. Photo Courtesy of U.S. Environmental Protection Agency (EPA).
Practice Type: Structural
Climatic Zones: Temperate
Regions: North America
Pollutants Treated: Nitrogen, Phosphorus, Sediment
N Efficiency1: 25%
P Efficiency1: 40%
S Efficiency1: 40%
Description: Erosion and sediment control practices protect water resources from sediment pollutionand increases in runoff associated with land development activities that disturb the soil. Erosion and sediment control uses a suite of practices to divert surface runoff to treatment areas (e.g., using terraces, berms, or swales), reducing water velocity (e.g., using check dams), filtering runoff (e.g., using silt fences), and removing suspended particles via settling or infiltration. As a result, soil is retained on site and sediment and nutrients are prevented from leaving the distrubed area and polluting streams.2
Implementation Considerations: Changes in factors relating to soil, vegetation, topography, or hydrologic conditions may alter the effectiveness of erosion and sediment control BMPs for removal of suspended solids or nutrients. For example, longer detention times behind silt fences may improve efficiency due to longer settling time. Efficiency can also be affected by the geomorphology of the unit; designs that maximize the area of contact between water and soil, vegetation, or microbial surfaces should in general increase efficiency. Increased vegetation density and biomass in swales or buffers is also likely to improve efficiency because of greater roughness, nutrient uptake, and more microbial surface area. While microbial removal processes that affect nitrogen removal are sustainable indefinitely under relatively constant environmental conditions, soil surfaces may become phosphorus-saturated, and further phosphorus sorption is therefore not possible. Capacity for sediment removal may also be impeded if high loading rates result in clogging or burial of vegetation. Additionally, high flow rates may lead to the formation of preferential flow pathways that reduce contact between water and microbes, soil, or vegetation.
Scalable to small farms? No
1 "Documentation: Source Data, BMP Effectiveness Values." Chesapeake Assessment Scenario Tool. Web. 2013. http://casttool.org/Documentation.aspx .
2 Estimates of County-level Nitrogen and Phosphorus Data for Use in Modeling Pollutant Reduction Documentation for Scenario Builder Version 2.2." Chesapeake Bay. Dec. 2010. Web. May 2013. http://archive.chesapeakebay.net/pubs/SB_V22_Final_12_31_2010.pdf.
Faidherbia Agroforestry
Category: Nutrient Recycling, Erosion Control
Practice Type: Management
Landuse/Agriculture Type: Row Crop, Small Grains
Climatic Zones: Semiarid, Arid
Regions: Africa
Pollutants Treated: Nitrogen, Phosphorus, Sediment
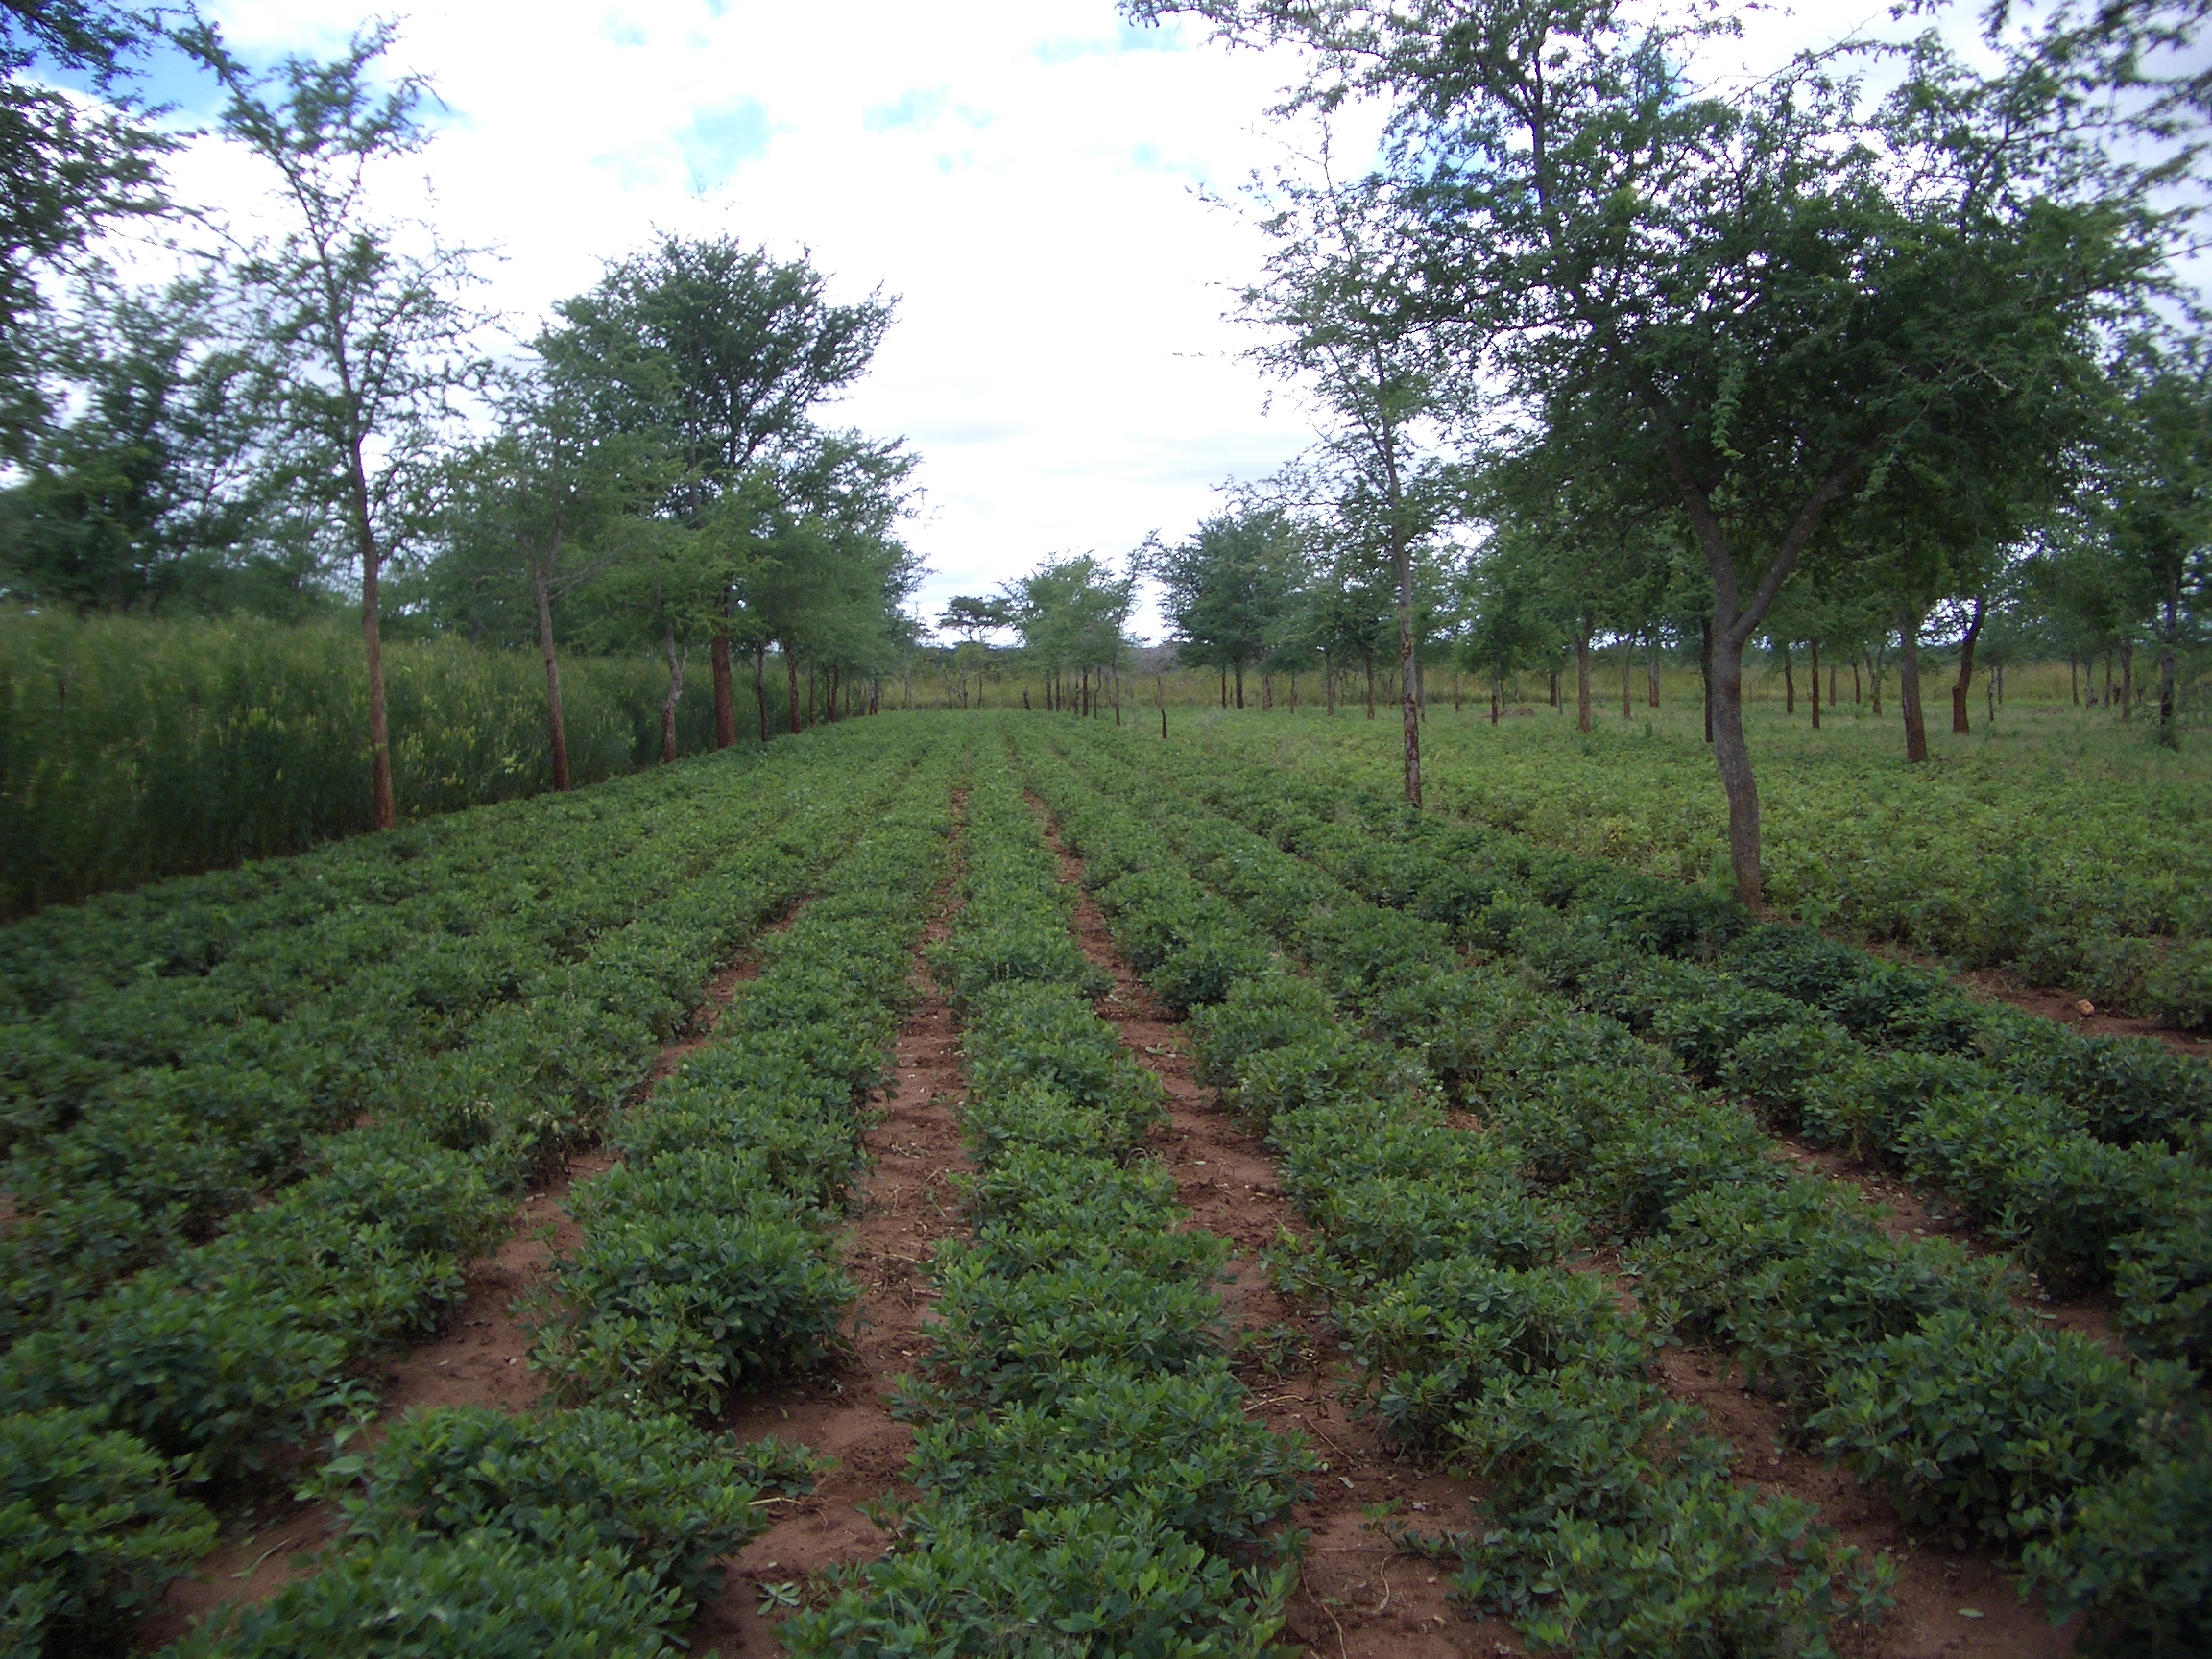
Description: In Africa, where soil fertility is low, planting Faidherbia trees in fields has provided a successful and low-cost way of improving yields through nutrient recycling. Faidherbia is a leguminous nitrogen-fixing acacia-like species that is indigenous all over Africa. Faidherbia has a unique compatibility with cropping systems due to its ‘reverse leaf phenology’ – it is dormant during the wet season and drops its leaves which then serve to fertilize associated crops. Its leaves only grow during the dry season and provide nutritious livestock fodder during critical periods of drought. If Faidherbia albida is cultivated with minimum tillage maize then this can provide organic fertilizer and abundant nutritious livestock fodder, sequester carbon, and offer protection from water and wind erosion. Permanent planting basins minimize primary tillage, concentrate nutrients, and harvest rainwater. This practice is being used by farmers in Malawi, Tanzania, Zambia, Niger, Nigeria, Burkina Faso, Mali, Senegal and several other countries in the Sahel. Farmers have reported that maize yields are doubled or tripled with this agroforestry practice.1
Scalable to small farms? Yes
1 "Faidherbia Albida; Keystone of Evergreen Agriculture in Africa." World Agroforestry Centre. Web. Oct. 2014..
Practice Type: Management
Landuse/Agriculture Type: Row Crop, Small Grains
Climatic Zones: Semiarid, Arid
Regions: Africa
Pollutants Treated: Nitrogen, Phosphorus, Sediment
Description: In Africa, where soil fertility is low, planting Faidherbia trees in fields has provided a successful and low-cost way of improving yields through nutrient recycling. Faidherbia is a leguminous nitrogen-fixing acacia-like species that is indigenous all over Africa. Faidherbia has a unique compatibility with cropping systems due to its ‘reverse leaf phenology’ – it is dormant during the wet season and drops its leaves which then serve to fertilize associated crops. Its leaves only grow during the dry season and provide nutritious livestock fodder during critical periods of drought. If Faidherbia albida is cultivated with minimum tillage maize then this can provide organic fertilizer and abundant nutritious livestock fodder, sequester carbon, and offer protection from water and wind erosion. Permanent planting basins minimize primary tillage, concentrate nutrients, and harvest rainwater. This practice is being used by farmers in Malawi, Tanzania, Zambia, Niger, Nigeria, Burkina Faso, Mali, Senegal and several other countries in the Sahel. Farmers have reported that maize yields are doubled or tripled with this agroforestry practice.1
Scalable to small farms? Yes
1 "Faidherbia Albida; Keystone of Evergreen Agriculture in Africa." World Agroforestry Centre. Web. Oct. 2014.
Feeding Area Rotation
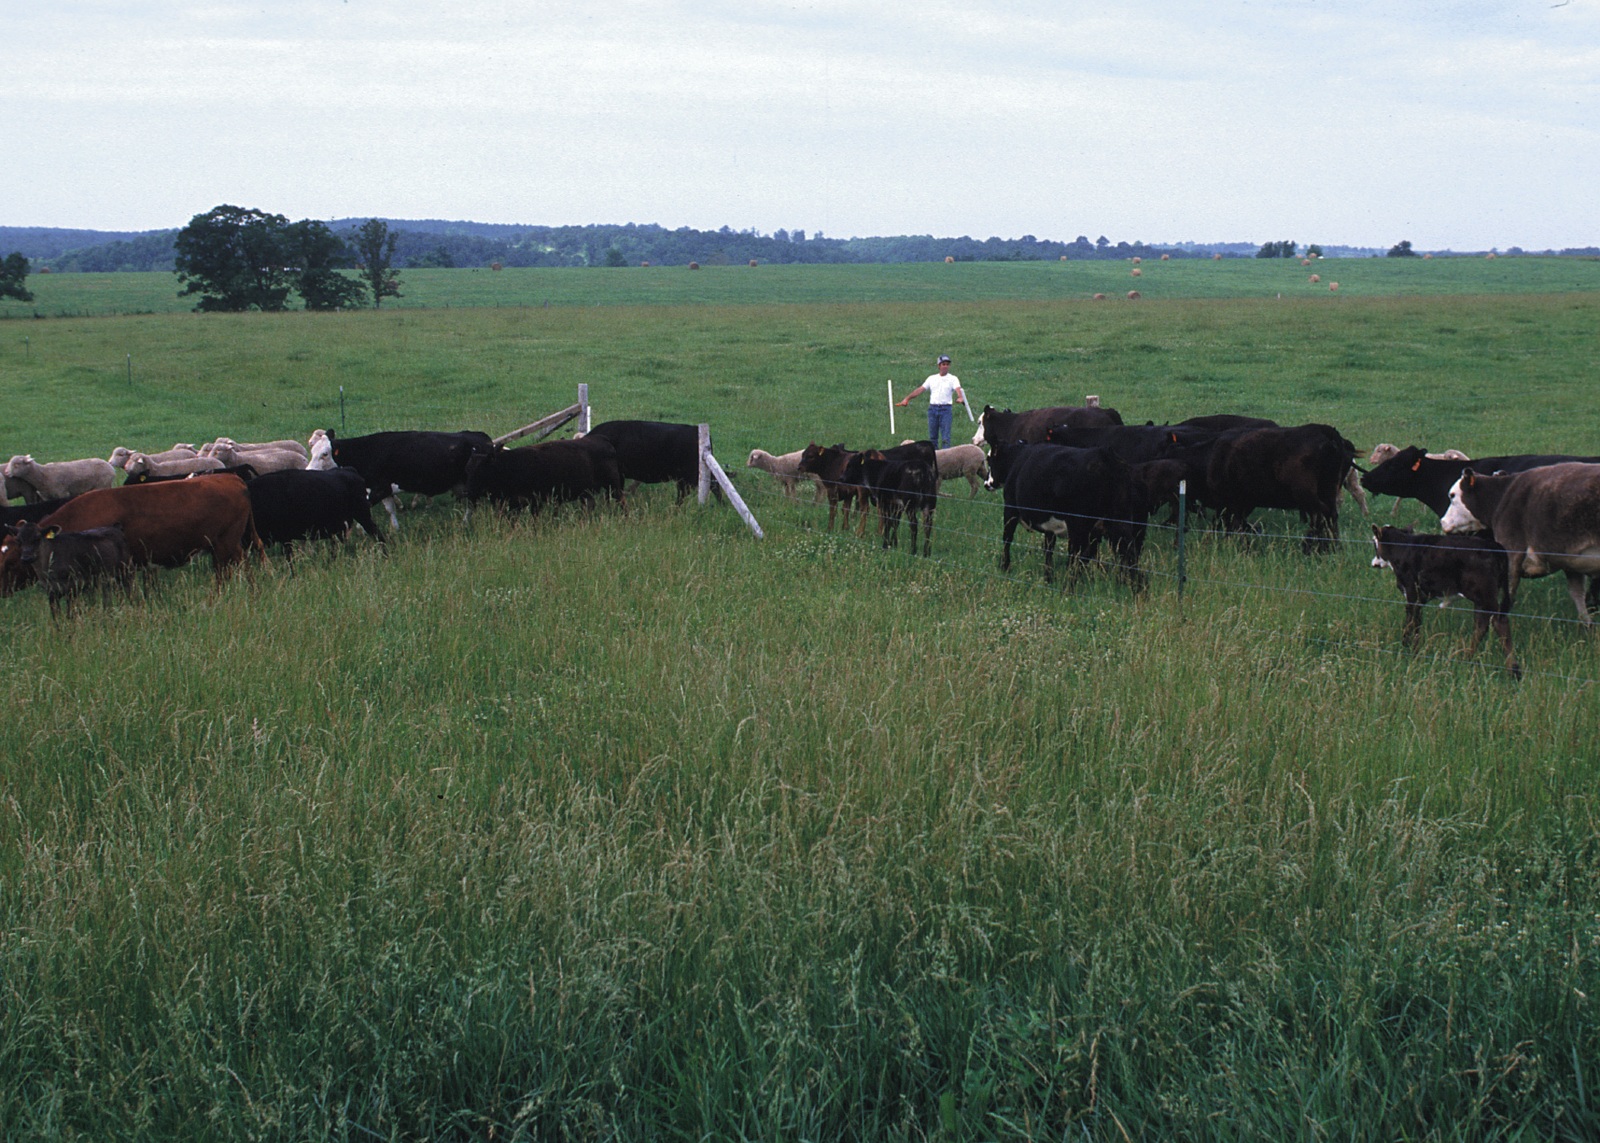 A Missouri rancher moves cattle and sheep from one paddock to another. Intensive rotational grazing systems like this keep pastures more productive. Photographer: Charlie Rahm. Photo courtesy of USDA NRCS.
Practice Type: Management
Landuse/Agriculture Type: Pasture
Climatic Zones: Temperate, Semiarid, Tropical
Regions: North America, South Asia, Europe
Pollutants Treated: Nitrogen, Phosphorus, Sediment
Description: Feeding area rotation is the rotation of feeding areas in grazing operations. Permanent feeding areas build up a lot of manure and can lead to excessive nutrient losses through runoff. Rotating the feeding areas can minimize manure buildup and nutrient runoff potential. Feeding area rotation can be implemented in several ways including (1) Delivering feed bales to a new spot each day (2) Relocating movable feed bunks or feeders (3) Moving portable windbreaks and (4) Extending the grazing season. 1
Implementation Considerations: Requires active management of feed area placement and portable feeding systems.
Scalable to small farms? No
1 "Beneficial Management Practices: Environmental Manual for Alberta Cow/Calf Producers." Alberta Agriculture and Rural Development. 2004. Web. Apr. 2014. http://www1.agric.gov.ab.ca/$department/deptdocs.nsf/all/epw8724/$FILE/FINAL_BMP_June_17.pdfhttp://www1.agric.gov.ab.ca/$department/deptdocs.nsf/all/epw8724/$FILE/FINAL_BMP_June_17.pdf .
Fertigation
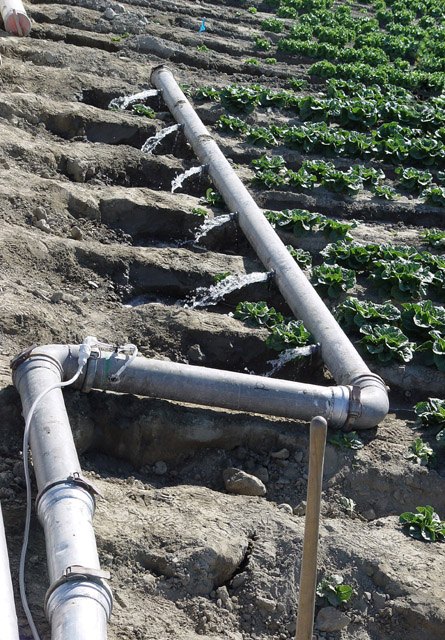 A fertigation system used on romaine lettuce in Coachella Valley, California. Metered chemical fertilizers are introduced through plastic tubing and injection ports at various points in the irrigation pipe. An elbow provides mixing of the injected chemical with the irrigation water, which is then distributed into multiple furrows.
Photo by Floyd Adamsen. Photo courtesy of USDA ARS.
Practice Type: Management
Landuse/Agriculture Type: Row Crop
Climatic Zones: Temperate, Semiarid, Tropical
Regions: South Asia
Pollutants Treated: Nitrogen, Phosphorus
Description: Fertigation is a method of applying fertilizers or other water soluble products needed for cropping through irrigation systems. Fertigation allows precise timing and uniform distribution of applied nutrients to meet the crop nutrient demand and ensures substantial savings in fertilizer usage. Fertigation also allows the timing and rate of application of nutrients to be controlled, reduces leaching, and increases nutrient absorption by the plants.1
Implementation Considerations: Fertigation could cause a loss of pressure in the main irrigation line and uses chemical fertilizers rather than organic.
Scalable to small farms? No
1 A.N. Ganeshamurthy, S.C. Kotur, H.B. Raghupathi, G.C. Satisha and L.R. Varalakshmi. Indian Journal of Fertilizers., (2013). Fertiliser Best Management Practices in Fruit Crops. Volume 9 (4), pp. 138-148
