-
Download:
My Results |
All BMPs
Riparian Grass Buffers
Category: Conservation Buffers
Practice Type: Structural
Landuse/Agriculture Type: Row Crop, Pasture, Fodder, Rice, Small Grains
Climatic Zones: Temperate, Semiarid, Tropical
Regions: North America, South Asia, Europe
Pollutants Treated: Nitrogen, Phosphorus, Sediment
N Efficiency1: 13-46%
P Efficiency1: 30-45%
S Efficiency1: 40-60%
Description: Riparian grass buffers are linear strips of grass or other non-woody vegetation maintained between the edge of fields and streams, rivers or tidal waters. They are generally in locations where runoff water leaves a field, with the intention that sediment, organic material, nutrients and chemicals can be filtered from the runoff water. Buffer vegetation can improve soil aeration, lessen water quality degradation by nutrient removal in the root zone by plant uptake and sorption to soil, and provide wildlife habitat. The efficiency of buffer zones in removing suspended solids and nutrients is affected by the width of the zone, gradient of the drained field, soil type and particularly by the variety and density of zone vegetation.2
Implementation Considerations: For either grass or tree buffers, width is the most important criteria. 10 m width should be considered as the goal. If land is limited, smaller width buffers are better than no buffer even though they have reduced efficiency. Establishment of buffers requires taking land out of crop production.but there are opportunities for harvesting fodder crops; Cost of establishing grass buffer low but it requires moderate maintenance costs. Over the long term, buffers are very cost effective practices in terms of dollars per pound of nutrient reduced.
Scalable to small farms? Yes
Scaling Considerations: Protected vegetated zones that are harvested for fodder have the potential to increase biomass compared to overgrazed streamside pastures.
1 "Documentation: Source Data, BMP Effectiveness Values." Chesapeake Assessment Scenario Tool. Web. 2013. http://casttool.org/Documentation.aspx .
2 Estimates of County-level Nitrogen and Phosphorus Data for Use in Modeling Pollutant Reduction Documentation for Scenario Builder Version 2.2." Chesapeake Bay. Dec. 2010. Web. May 2013. http://archive.chesapeakebay.net/pubs/SB_V22_Final_12_31_2010.pdf.; "EU Database of Best Practices." Living Water Exchange: Promoting Replication of Good Practices for Nutrient Reduction and Joint Collaboration in Central and Eastern Europe. Web. Sept. 2013. http://nutrient2.iwlearn.org/nutrient-reduction-practices/eu-database-of-practices/view.
Rotational Cropping Systems
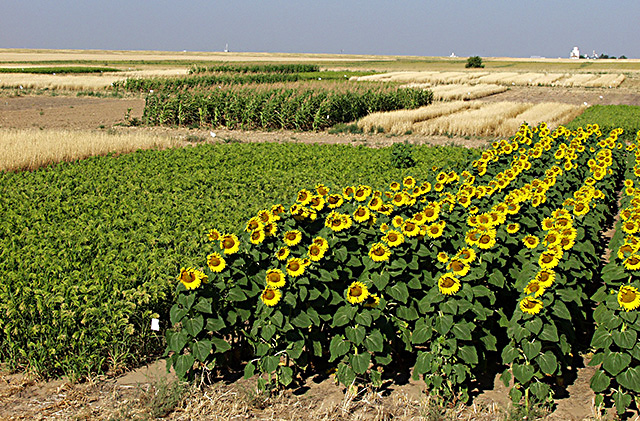
 Sunflowers and proso millet plots in the alternative crop rotation plots. In this experiment 23 alternative no-till dryland-crop rotations are compared to the old wheat-fallow system. Photo by David Nielsen. Photo Courtesy of USDA ARS.
Practice Type: Management
Landuse/Agriculture Type: Row Crop, Small Grains, Fodder
Climatic Zones: Temperate, Semiarid, Tropical
Regions: North America, Europe, South America, South Asia, South Africa
Pollutants Treated: Nitrogen, Phosphorus, Sediment
Description: Rotational cropping is a system whereby several different crops are grown in planned succession on the same field over different seasons, as opposed to growing the same crop year after year. The purpose of crop rotation is to help maintain the balance of nutrients, organic matter, and microorganisms necessary for healthy soil. Many crop rotations may include legumes to help fix nitrogen in the soil for use by subsequent crops. Crop rotation provides several benefits including improved soil fertility, pest management, weed reduction and disease control. 1
Implementation Considerations: Rotational cropping systems are generally beneficial both financially and environmentally. This practice should be implemented in a way that maximizes crop diversity within the site constraints. This practice should be used in conjunction with other agricultural best management practices.
Scalable to small farms? Yes
1 Miller, T. P. , J. R. Peterson, C. F. Lenhart, and Y. Nomura. 2012. The Agricultural BMP Handbook for Minnesota. Minnesota Department of Agriculture.
Rotational Grazing
Category: Grazing Management
Practice Type: Structural, Management
Landuse/Agriculture Type: Pasture
Climatic Zones: Temperate, Semiarid, Tropical
Regions: North America, Europe, South America, South Asia, South Africa
Pollutants Treated: Nitrogen, Phosphorus, Sediment
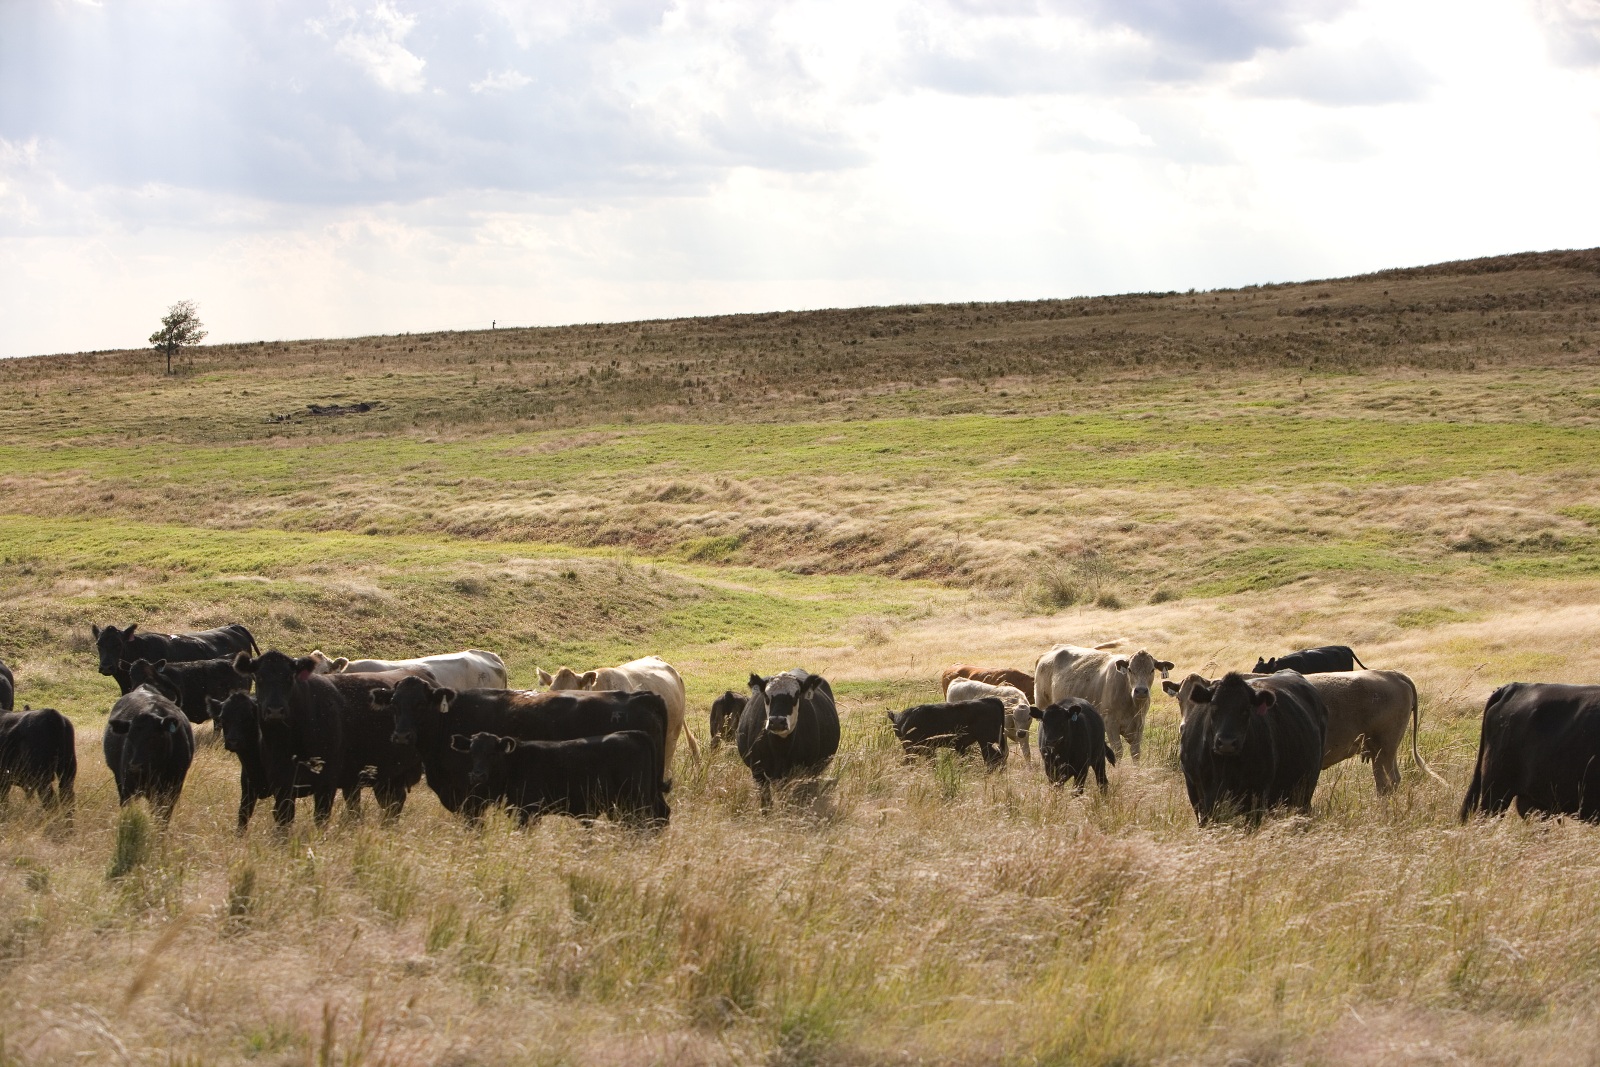
Description: Rotational grazing, sometimes referred to as prescribed grazing, is where the pasture area is divided into two or more subpastures, also called “paddocks,” with each subpasture being grazed and “rested” in turn. Putting the whole herd in a small paddock results in rapid use of available forage. When a paddock is grazed off, animals are moved to a fresh one, allowing each paddock to be grazed clean and to have a rest period. The rest period is critical for the continued productivity of some forage species. Rotational grazing improves the quantity and quality of forage, thereby reducing soil erosion, increases infiltration, and reduces runoff. As a result soil and nutrient losses are minimized. 1
Implementation Considerations: Ability to implement a rotational grazing system will depend on stocking rates and available pasture. Rotational grazing is more labor intensive and requires investment in fencing and watering systems to create the paddocks.
Scalable to small farms? Yes
1 "Pastures: Grazing Management." Penn State Extension: College of Agricultural Sciences. Web. July 2014. http://extension.psu.edu/agronomy-guide/cm/sec8/sec810l .
Sand and Organic Filters
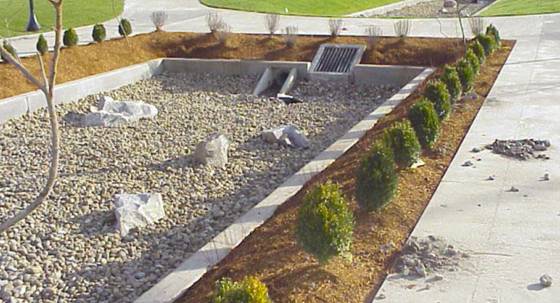
 Sand filter at Cascade Station (NE Airport Way & I-205). City of Portland 2004 Stormwater Management Manual.
Practice Type: Structural
Landuse/Agriculture Type:
Climatic Zones: Temperate
Regions: North America
Pollutants Treated: Nitrogen, Phosphorus, Sediment
N Efficiency1: 40%
P Efficiency1: 60%
S Efficiency1: 80%
Description: Filters capture and temporarily store runoff, passing it through a filter bed of either sand or organic media. Sand filters can be above ground, below ground, or around a perimeter. Organic media filters use a medium besides sand to enhance pollutant removal with increased cation exchange capacity.2
Implementation Considerations: Design calculations must be done by a qualified engineer familiar with hydrology and hydraulics. This practice will have detailed design standards for slope, velocity, infiltration rates, width, residence time, manning n value, maintenance, pipe placement, soil amendments, and various other design elements. Organic filters can leach nutrients if the organic matter begins to break down but may achieve higher retention than sand filters.
Scalable to small farms? No
1 "Documentation: Source Data, BMP Effectiveness Values." Chesapeake Assessment Scenario Tool. Web. 2013. http://casttool.org/Documentation.aspx .
2 Simpson, Thomas, and Sarah Weammert. "Developing Best Management Practice Definitions and Effectiveness Estimates for Nitrogen, Phosphorus and Sediment in the Chesapeake Bay Watershed." Chesapeake Bay Program. Dec. 2009. Web. June 2013. http://archive.chesapeakebay.net/pubs/BMP_ASSESSMENT_REPORT.pdf.
Septic Denitrification
Category: Septic
Practice Type: Structural
Landuse/Agriculture Type:
Climatic Zones: Temperate
Regions: North America
Pollutants Treated: Nitrogen, Phosphorus, Sediment
N Efficiency1: 50%
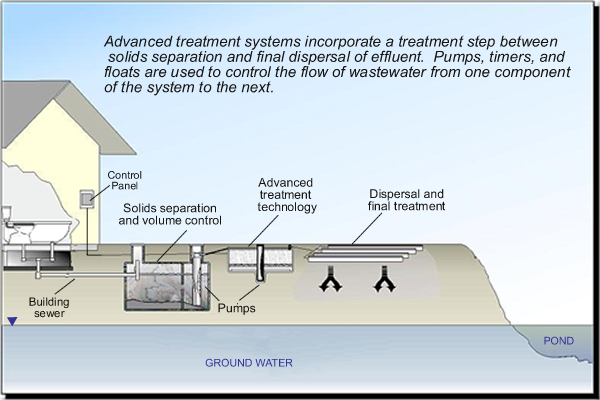
Description: Septic denitrification represents the replacement of tradition septic systems with more advanced systems that have additional nitrogen removal capabilities. Traditional septic systems usually consist of a large tank designed to hold the wastewater allowing grits and solids time for settling and decomposition. Wastewater then flows to the second component, the drainfield. An enhanced septic system can provide further treatment of nitrogen through processes that encourage denitrification of the wastewater.2
Implementation Considerations: Denitrification systems are most effective when used as part of a BMP system which involves source reduction through elimination of garbage disposals and use of low-volume plumbing fixtures. Septic denitrification systems are more expensive to own and operate than traditional septic systems.
Scalable to small farms? No
1 "Documentation: Source Data, BMP Effectiveness Values." Chesapeake Assessment Scenario Tool. Web. 2013. http://casttool.org/Documentation.aspx .
2 Estimates of County-level Nitrogen and Phosphorus Data for Use in Modeling Pollutant Reduction Documentation for Scenario Builder Version 2.2." Chesapeake Bay. Dec. 2010. Web. May 2013. http://archive.chesapeakebay.net/pubs/SB_V22_Final_12_31_2010.pdf.


